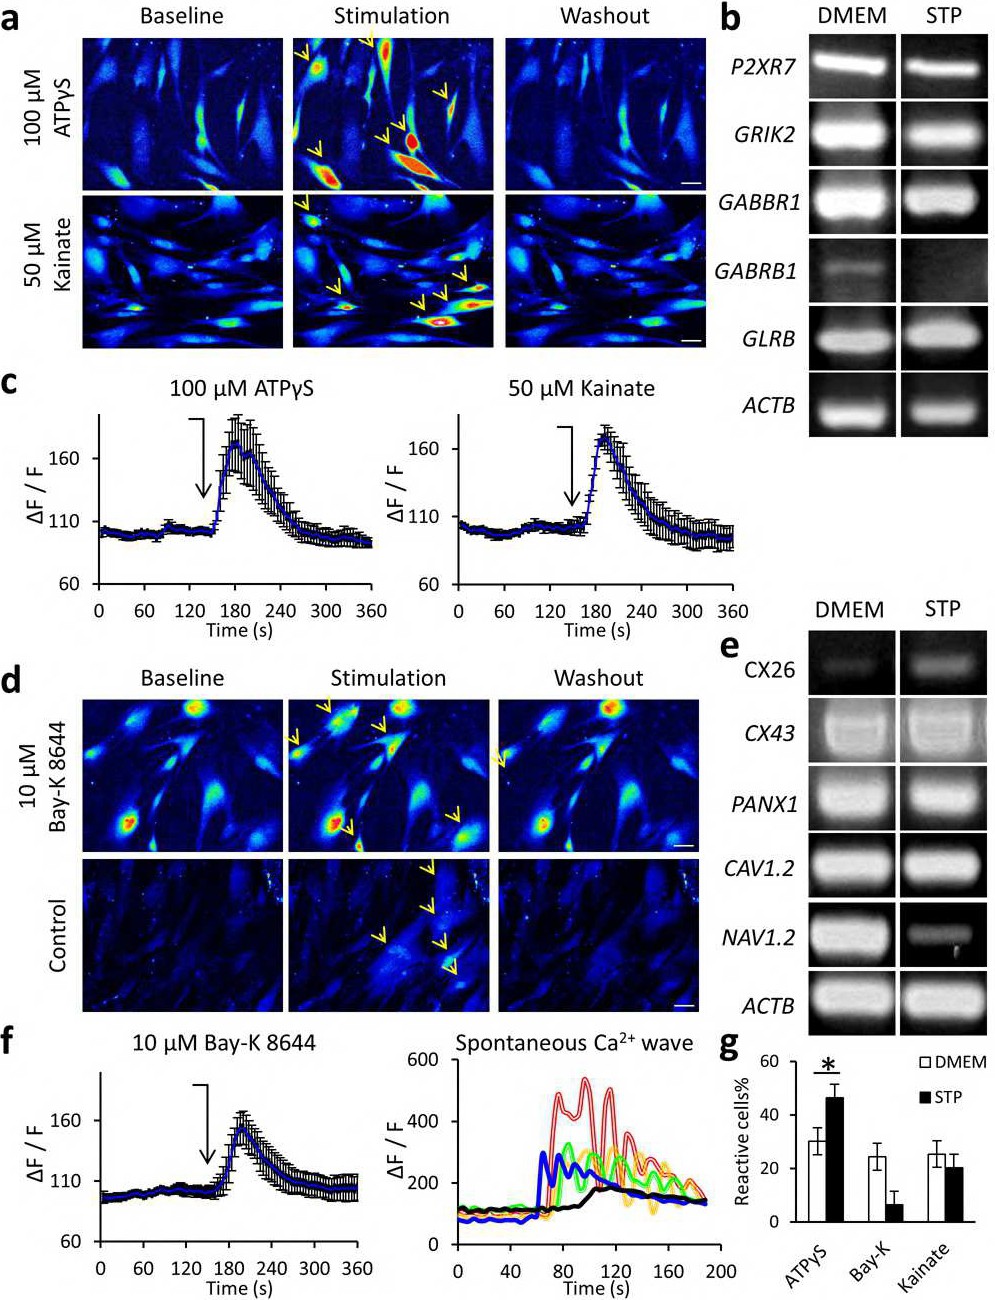
Fig. 2. Presence of functional neurotransmitter receptors, voltage-dependent Ca2+ channels, hemichannels and GAP junctions on hDPSCs: a) Some hDPSC showed functional Ca2+ responses (yellow arrows) to stimulation with 50 µM Kainate and 100 µM ATPʏS. Scale bar 50 µm. b) Conventional RT-PCR bands showing expression of subunits of neurotransmitter receptors P2XR7 (ATP), GRIK2 (Kainate), GABBR1 (GABAB), GABRB1 (GABAA), GLRB (Glycine). c) Plotting of Fluo-4 fluorescence live measurements before and after stimulation of hDPSCs for 30 s with 50 µM Kainate and 100 µM ATPʏS. Mean ± SEM. ΔF/F Fluo-4 fluorescence signal of different hDPSCs within a same coverslip (n= 14 and 6, respectively). d) hDPSCs showed functional Ca2+ responses to stimulation with 10 µM Bay-K 8644 (yellow arrows). Regions of cell confluence occasionally showed spontaneously propagating calcium waves. Scale bar 50 µm. e) Conventional RT-PCR bands showing expression of Connexin (CX26, CX43) and Pannexin (PANX1) subunits, and L-type voltage gated calcium (Cav1.2) channel subunits and sodium channels (Nav1.2). f) Plotting of Fluo-4 fluorescence live measurements before and after stimulation of hDPSCs for 30 s with 10 µM Bay-K 8644, and spontaneous Ca2+ wave recorded on confluent hDPSCs in the absence of pharmacological stimulation. g) Global quantifications of Ca2+ responsive hDPSCs to different pharmacological treatments. Percentage of hDPSC responding cells vs total cells in cultures grown with DMEM+10% FBS or STP media. Global rates of response to ATPʏS, Bay-K 8644 and Kainate were analyzed (n= 50 to 100 cells from 3 independent hDPSCs cultures). Statistics were analyzed by Mann Whitney *=p<0.05. Movies 1-4 corresponding to frames shown in a) and d) are available as supplementary material. Supplementary movie 5 also shows the triggering of Ca2+ waves by stimulation with ATPʏS, Bay-K 8644 and Kainate in confluent cells.